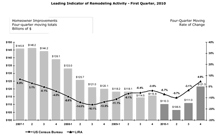
The level of remodeling activity nationally reached a bottom in the first quarter of this year, according to the latest release of the Residential Remodeling Index (RRI) by Hanley Wood. The seasonally adjusted first quarter national composite of the RRI declined less than 0.2% from the last quarter of 2009. The RRI forecasts a 1% increase in the second quarter of 2010, the first quarter-over-quarter improvement in two years.

While the second quarter 2010 forecast still represents a 2% decline year-over-year, Hanley Wood forecasts continued acceleration of remodeling activity through the end of 2010 and into the beginning of 2011. That growth would rival the growth experienced in 2005 and early 2006.
“Our new forecast for remodeling represents a substantial change from our view at the beginning of the year,” said Jonathan Smoke, Hanley Wood’s Senior Vice President of Market Intelligence Products & Innovation and the architect of the RRI. “At the beginning of the year, we didn’t see conditions improving until 2011. But in the first quarter we’ve seen an uptick in activity in many markets and as a result, it appears the industry has seen the bottom of this downturn.”
“Not all markets are rebounding,” says Smoke, noting that while several MSA’s are above the RRI’s baseline 100 level, some still measure below 50, indicating that they have less than half the volume of projects compared with 2007. “Remodelers in Washington, DC, the MSA with the highest RRI score in the first quarter, are in a much better position than those in Akron, OH, which had one of the lowest scores,” Smoke said.
The RRI confirms anecdotal evidence of increasing remodeling activity. “We are hearing good news in several markets, particularly around products and projects that can capture tax credits and stimulus funded incentives,” said Rick Strachan, Hanley Wood’s Executive Director Residential Remodeling.
About the Residential Remodeling Index
The RRI is a quarterly measure of the level of remodeling activity in 366 metropolitan statistical areas (MSA) in the U.S., with the national composite reflecting the national level of activity. “Activity” includes home improvement and replacement projects, but does not include maintenance or projects of less than $500. The seasonally adjusted index shows the relative level of activity in the geography specified (MSA or national composite) compared to 2007 (the baseline year). A number above 100 indicates a level of remodeling activity higher than the level of activity at the beginning of 2007, which was the peak of remodeling activity in the prior decade. The index is produced through a statistical model that leverages detailed data on remodeling activity, including household level remodeling permits, and consumer reported remodeling and replacement projects. Quarterly historical results for the national composite and for each of the 366 Metropolitan Statistical Areas in the U.S. are available back to 2004